IAP || Endorser Tips: "A. A successful book endorsement is...
brief—50 to 200 words
informal—sounds like one colleague talking to another
explains how this book is unique
B. Things to point out about the book are...
its intended audience
its place in the history of the discipline
the author’s role or status in the discipline
C. Book endorsements might appear...
on the back cover of the book
on the book’s webpage
in printed flyers advertising the book
in email announcements of the book
D. Your endorsement should include...
your name exactly as you wish it to appear
other information indicating your place in the discipline (e.g., institution, awards, national offices held, and the like)
"
'via Blog this'
Tuesday, March 3, 2015
Friday, February 20, 2015
UT Arlington Link Lab
Skip to main content
The University of Texas at Arlington (UT Arlington) Division of Digital Teaching and Learning invites applications and nominations for a Post-Doctoral Fellowship, in support of the university’s continuing commitment to advance scholars from underrepresented groups in higher education. The relationship between work and formal education is changing. A traditional view holds that formal education prepares individuals for a lifetime of employment. Education in this view is event based. Essentially, once the degree has been completed, the individual moves into the workforce. However, as a result of the complexities and challenges associated with the modern economy, this model is no longer the norm. The traditional full time student is now a minority in the USA, as part time learners and mid-career masters students and alternative programs (such as competency based and online learning) increase in numbers. The nature of work and employment is also changing, as routine labor is increasingly automated. Bill Gates recently stated that within a decade, 50% of today’s jobs will be automated. The repercussions that this has for the economy and the quality of life for people are significant. The impact on the future of universities and colleges, specifically in relation to how higher education prepares individuals for employment, is an important area of research. The skills/employment gap refers to the relationship between what learners know and can do when they graduate and what employers expect. A second gap, that of developing the whole person (such as in a liberal arts education) versus developing an individual for primary employment, also exists as work moves to a creative economy. The balance between formal education, learning, work, creativity, and knowledge advancement will be the primary focus of this post doc position.
This position will appeal to individuals with strong awareness of labor data, employment trends, and how automation is altering work and how this in turn influences the role of higher education institutions in society. Applicants will have a completed, or soon to be completed, PhD in areas related to this position with research experience using job and labor statistics, a strong background in digital learning pedagogies in higher education. Position reports to Executive Director of the LINK Research Lab, George Siemens.
Arlington, Texas is centrally located to major cultural, sporting, and entertainment venues, situated in the heart of the Dallas-Ft. Worth metropolitan area, with over 6 million residents and more than twenty municipalities (http://www.dfwandbeyond.com/cities).
The position will run for duration of three years with annual renewals. Fellow will receive a stipend of $50,000 USD each year negotiable based on experience. UT Arlington will also provide each Fellow with a medical and dental benefits package.
Applications should include: a cover letter detailing interest and background, a complete CV and a statement of experience and what the candidate would like to achieve in this position
This position contributes significantly to University of Texas Arlington’s new strategic plan (http://www.uta.edu/strategicplan/), notably regarding sustainable communities (and megacities), sustainability, global impact, health and the human condition, and data-driven discovery.
Specific activities include:
1. Conducting research (including grant writing and co-supervision of doctoral students)
2. Engagement with state and national agencies in assessing and evaluating prominent employment trends
3. Identification and assessment of effectiveness of new higher education and work-to-university-to-work models
4. Developing models of employment and higher education interaction (triple helix model)
5. Evaluation of the economic impact of higher education on regional economies as employees return to universities to re-skill/upgrade
6. Presenting at the major conferences in the knowledge domains relevant to this position
7. Publishing in the major journals in the field;
8. Interacting with some stakeholder (internal and external to the university) groups/partners;
9. Institutional collaboration and knowledge transfer/translation to Texas and national university systems
10. Analysis of international labor and education trends
11. Translation of research findings to practice
Applications materials should be submitted digitally to:
Laurel Mayo, Director, LINK Research Lab
email address: lsmayo@uta.edu
By March 16,2015. Applicants will be notified of decisions by April 13,2015, and commitments must be made by April 27, 2015.
A criminal background check will be conducted on all finalists. The use of tobacco products is prohibited at UT Arlington The University of Texas at Arlington does not discriminate on the basis of race, color, national origin, sex, religion, age, disability, veteran status or sexual orientation in employment or in the provision of services.


Job Posting
Post-Doctoral Fellowship - Digital Teaching & Learning
| Post Date: | February 13, 2015 |
| Academic Unit: | (School or College) |
| Search Code: | DDTL02122015PDF |
| Position/Job Description: | |
The University of Texas at Arlington (UT Arlington) Division of Digital Teaching and Learning invites applications and nominations for a Post-Doctoral Fellowship, in support of the university’s continuing commitment to advance scholars from underrepresented groups in higher education. The relationship between work and formal education is changing. A traditional view holds that formal education prepares individuals for a lifetime of employment. Education in this view is event based. Essentially, once the degree has been completed, the individual moves into the workforce. However, as a result of the complexities and challenges associated with the modern economy, this model is no longer the norm. The traditional full time student is now a minority in the USA, as part time learners and mid-career masters students and alternative programs (such as competency based and online learning) increase in numbers. The nature of work and employment is also changing, as routine labor is increasingly automated. Bill Gates recently stated that within a decade, 50% of today’s jobs will be automated. The repercussions that this has for the economy and the quality of life for people are significant. The impact on the future of universities and colleges, specifically in relation to how higher education prepares individuals for employment, is an important area of research. The skills/employment gap refers to the relationship between what learners know and can do when they graduate and what employers expect. A second gap, that of developing the whole person (such as in a liberal arts education) versus developing an individual for primary employment, also exists as work moves to a creative economy. The balance between formal education, learning, work, creativity, and knowledge advancement will be the primary focus of this post doc position.
This position will appeal to individuals with strong awareness of labor data, employment trends, and how automation is altering work and how this in turn influences the role of higher education institutions in society. Applicants will have a completed, or soon to be completed, PhD in areas related to this position with research experience using job and labor statistics, a strong background in digital learning pedagogies in higher education. Position reports to Executive Director of the LINK Research Lab, George Siemens.
Arlington, Texas is centrally located to major cultural, sporting, and entertainment venues, situated in the heart of the Dallas-Ft. Worth metropolitan area, with over 6 million residents and more than twenty municipalities (http://www.dfwandbeyond.com/cities).
The position will run for duration of three years with annual renewals. Fellow will receive a stipend of $50,000 USD each year negotiable based on experience. UT Arlington will also provide each Fellow with a medical and dental benefits package.
Applications should include: a cover letter detailing interest and background, a complete CV and a statement of experience and what the candidate would like to achieve in this position
This position contributes significantly to University of Texas Arlington’s new strategic plan (http://www.uta.edu/strategicplan/), notably regarding sustainable communities (and megacities), sustainability, global impact, health and the human condition, and data-driven discovery.
Specific activities include:
1. Conducting research (including grant writing and co-supervision of doctoral students)
2. Engagement with state and national agencies in assessing and evaluating prominent employment trends
3. Identification and assessment of effectiveness of new higher education and work-to-university-to-work models
4. Developing models of employment and higher education interaction (triple helix model)
5. Evaluation of the economic impact of higher education on regional economies as employees return to universities to re-skill/upgrade
6. Presenting at the major conferences in the knowledge domains relevant to this position
7. Publishing in the major journals in the field;
8. Interacting with some stakeholder (internal and external to the university) groups/partners;
9. Institutional collaboration and knowledge transfer/translation to Texas and national university systems
10. Analysis of international labor and education trends
11. Translation of research findings to practice
Applications materials should be submitted digitally to:
Laurel Mayo, Director, LINK Research Lab
email address: lsmayo@uta.edu
By March 16,2015. Applicants will be notified of decisions by April 13,2015, and commitments must be made by April 27, 2015.
A criminal background check will be conducted on all finalists. The use of tobacco products is prohibited at UT Arlington The University of Texas at Arlington does not discriminate on the basis of race, color, national origin, sex, religion, age, disability, veteran status or sexual orientation in employment or in the provision of services.
| Back to Search Page |
News and Announcements
- Join us for UT System Founders Day 2014!
- Merit Increase Guidelines for FY 14-15
- Holiday Schedule and Vacation Regulations for 2014-2015
- LGBTQA Program
- Wellness at UTA
- Affordable Care Act (ACA) Resources
- 2014 Performance Review Memorandum
- Outstanding Maverick Awards Program
- New Criminal Background Check Procedure
- University Opens Lactation Rooms
- UT Arlington Named Fit-Friendly Worksite
- Change to Cafeteria Plan
- Tobacco Free
- Retirees Club
- Dearborn National Offers Online Services
- Using Your UT EID and UT Direct Self Service Features
Quick Links
Benefits and Services
- Affordable Care Act (ACA)
- News About Your Benefits
- UT Arlington Work/Life Balance Resources
- Employee Assistance Program
- 2014-2015 Holiday Schedule and Vacation Regulations
- Benefits of Working at UT Arlington
- Employee Tuition Assistance Plan
- Wellness Programs
- Retirees Club
- Americans with Disabilities Act (ADA) for Faculty and Staff
- Criminal Background Checks
Compensation and Employee Relations
- Pay Plan and Job Descriptions
- Performance Management Guide
- Merit Increase Guidlines FY2015
- Employee Separation Process
- Exit Interview Program
Learning and Development
Log in
Tuesday, May 20, 2014
Online Learning and Student Outcomes in Community Colleges (PPIC Publication)
Online Learning and Student Outcomes in Community Colleges (PPIC Publication):
Retention in California Community Colleges
'via Blog this'
Retention in California Community Colleges
'via Blog this'
Tuesday, May 13, 2014
The New CIO: Bruce Maas -- Campus Technology
The New CIO: Bruce Maas -- Campus Technology: "At UW-Madison, we have consciously separated the role of operations leader for IT from the CIO, to allow the CIO to work more strategically on mission-critical services. "
'via Blog this'
'via Blog this'
Tuesday, May 6, 2014
Discussion Section - Purdue OWL: Writing in Psychology: Experimental Report Writing
Purdue OWL: Writing in Psychology: Experimental Report Writing: "Begin by providing an interpretation of your results: what is it that you have learned from your research?
Discuss each hypotheses or research question in more depth.
Do not repeat what you have already said in your results—instead, focus on adding new information and broadening the perspective of your results to you reader.
Discuss how your results compare to previous findings in the literature. If there are differences, discuss why you think these differences exist and what they could mean.
Briefly consider your study's limitations, but do not dwell on its flaws.
Consider also what new questions your study raises, what questions your study was not able to answer, and what avenues future research could take in this area.
"
'via Blog this'
Sunday, May 4, 2014
Learning through social networking sites – the critical role of the teacher...: EBSCOhost
Learning through social networking sites – the critical role of the teacher...: EBSCOhost:
level of success of SNS learning activities can vary between classes depending on the way they are implemented.
social media
'via Blog this'
level of success of SNS learning activities can vary between classes depending on the way they are implemented.
social media
'via Blog this'
Pearson - Social Media for Teaching and Learning - Social Media Survey 2013
Pearson - Social Media for Teaching and Learning - Social Media Survey 2013: "
Annual survey of social media use by higher education faculty, 2013
Since 2009, Pearson has been researching faculty use of social media. As a learning company that promotes the effective use of technology, Pearson is acutely aware of how important it is to understand these emerging media, the opportunities they offer to higher education faculty, and how their adoption can evolve—and is evolving—teaching and learning in higher education. Pearson's ongoing collaboration with thought leaders from such organizations as the Babson Survey Research Group is enabling us to strengthen that understanding. As a reflection of our commitment to sharing our knowledge with the higher education community, the following pages contain the findings of our 2013 Social Media in Higher Education survey."
'via Blog this'
Multicollinearity
Multicollinearity: "How to detect multicollinearity?
Formally, variance inflation factors (VIF) measure how much the variance of the estimated coefficients are increased over the case of no correlation among the X variables. If no two X variables are correlated, then all the VIFs will be 1.
If VIF for one of the variables is around or greater than 5, there is collinearity associated with that variable.
The easy solution is: If there are two or more variables that will have a VIF around or greater than 5, one of these variables must be removed from the regression model.
"
'via Blog this'
Regression with SPSS: Lesson 2 - Regression Diagnostics
Regression with SPSS: Lesson 2 - Regression Diagnostics: "The histogram shows some possible outliers. We can use the outliers(sdresid) and id(state) options to request the 10 most extreme values for the studentized deleted residual to be displayed labeled by the state from which the observation originated. Below we show the output generated by this option, omitting all of the rest of the output to save space. You can see that "dc" has the largest value (3.766) followed by "ms" (-3.571) and "fl" (2.620)"
'via Blog this'
'via Blog this'
AndrewDart.co.uk : Reporting Multiple Regressions in APA format – Part One
AndrewDart.co.uk : Reporting Multiple Regressions in APA format – Part One: "Reporting Multiple Regressions in APA format – Part One
So this is going to be a very different post from anything I have put up before. I am writing this because I have just spent the best part of two weeks trying to find the answer myself without much luck. Sure I came across the odd bit of advice here and there and was able to work a lot of it out, but so many of the websites on this topic leave out a bucket load of the information, making it difficult to know what they are actually going on about. So after two weeks of wading through websites, texts book and having multiple meetings with my university supervisors, I thought I would take the time to write up some instructions on how to report multiple regressions in APA format so that the next poor sap who has this issue doesn’t have to waste all the time I did. If you have no interest in statistics then I recommend you skip the rest of this post."
'via Blog this'
Linear Regression Analysis in SPSS - Procedure, assumptions and reporting the output.
Linear Regression Analysis in SPSS - Procedure, assumptions and reporting the output.:
'via Blog this'
'via Blog this'
Introduction
Linear regression is the next step up after correlation. It is used when we want to predict the value of a variable based on the value of another variable. The variable we want to predict is called the dependent variable (or sometimes, the outcome variable). The variable we are using to predict the other variable's value is called the independent variable (or sometimes, the predictor variable). For example, you could use linear regression to understand whether exam performance can be predicted based on revision time; whether cigarette consumptions can be predicted based on smoking duration; and so forth. If you have two or more independent variables, rather than just one, you need to use multiple regression.
This "quick start" guide shows you how to carry out linear regression using SPSS, as well as interpret and report the results from this test. However, before we introduce you to this procedure, you need to understand the different assumptions that your data must meet in order for linear regression to give you a valid result. We discuss these assumptions next.
SPSStop ^
Assumptions
When you choose to analyse your data using linear regression, part of the process involves checking to make sure that the data you want to analyse can actually be analysed using linear regression. You need to do this because it is only appropriate to use linear regression if your data "passes" six assumptions that are required for linear regression to give you a valid result. In practice, checking for these six assumptions just adds a little bit more time to your analysis, requiring you to click a few more buttons in SPSS when performing your analysis, as well as think a little bit more about your data, but it is not a difficult task.
Before we introduce you to these six assumptions, do not be surprised if, when analysing your own data using SPSS, one or more of these assumptions is violated (i.e., not met). This is not uncommon when working with real-world data rather than textbook examples, which often only show you how to carry out linear regression when everything goes well! However, don’t worry. Even when your data fails certain assumptions, there is often a solution to overcome this. First, let’s take a look at these six assumptions:
- Assumption #1: Your two variables should be measured at the interval or ratio level (i.e., they are continuous). Examples of variables that meet this criterion include revision time (measured in hours), intelligence (measured using IQ score), exam performance (measured from 0 to 100), weight (measured in kg), and so forth. You can learn more about interval and ratio variables in our article:Types of Variable.
- Assumption #2: There needs to be a linear relationship between the two variables. Whilst there are a number of ways to check whether a linear relationship exists between your two variables, we suggest creating a scatterplot using SPSS, where you can plot the dependent variable against your independent variable, and then visually inspect the scatterplot to check for linearity. Your scatterplot may look something like one of the following:
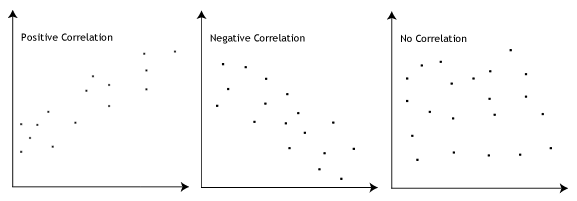
If the relationship displayed in your scatterplot is not linear, you will have to either run a non-linear regression analysis or “transform” your data, which you can do using SPSS. In our enhanced guides, we show you how to: (a) create a scatterplot to check for linearity when carrying out linear regression using SPSS; (b) interpret different scatterplot results; and (c) transform your data using SPSS if there is not a linear relationship between your two variables. - Assumption #3: There should be no significant outliers. Outliers are simply single data points within your data that do not follow the usual pattern (e.g., in a study of 100 students’ IQ scores, where the mean score was 108 with only a small variation between students, one student had a score of 156, which is very unusual, and may even put her in the top 1% of IQ scores globally). The following scatterplots highlight the potential impact of outliers:
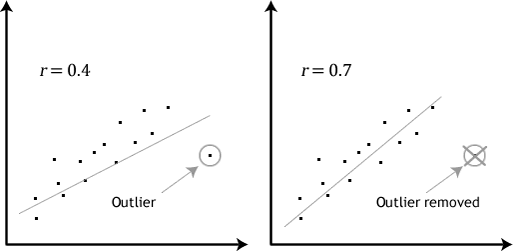
The problem with outliers is that they can have a negative effect on the regression equation that is used to predict the value of the dependent (outcome) variable based on the independent (predictor) variable. This will change the output that SPSS produces and reduce the predictive accuracy of your results. Fortunately, when using SPSS to run linear regression on your data, you can easily include criteria to help you detect possible outliers. In our enhanced linear regression guide, we: (a) show you how to detect outliers using "casewise diagnostics", which is a simple process when using SPSS; and (b) discuss some of the options you have in order to deal with outliers. - Assumption #4: You should have independence of observations, which you can easily check using the Durbin-Watson statistic, which is a simple test to run using SPSS. We explain how to interpret the result of the Durbin-Watson statistic in our enhanced linear regression guide.
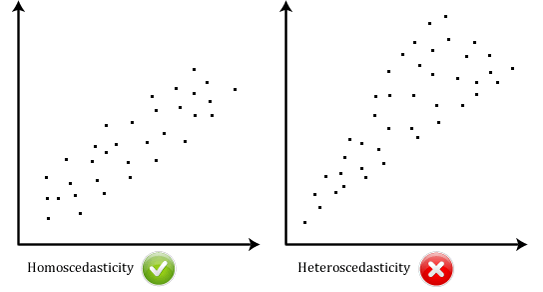
- Assumption #5: Your data needs to show homoscedasticity, which is where the variances along the line of best fit remain similar as you move along the line. Whilst we explain more about what this means and how to assess the homoscedasticity of your data in our enhanced linear regression line, take a look at the two scatterplots below, which provide two simple examples: one of data that meets this assumption and one that fails the assumption:When you analyse your own data, you will be lucky if your scatterplot looks like either of the two above. Whilst these help to illustrate the differences in data that meets or violates the assumption of homoscedasticity, real-world data is often a lot more messy. Therefore, in our enhanced linear regression guide, we explain: (a) some of the things you will need to consider when interpreting your data; and (b) possible ways to continue with your analysis if your data fails to meet this assumption.
- Assumption #6: Finally, you need to check that the residuals (errors) of the regression line are approximately normally distributed(we explain these terms in our enhanced linear regression guide). Two common methods to check this assumption include using either a histogram (with a superimposed normal curve) or by using a Normal P-P Plot. Again, in our enhanced linear regression guide, we: (a) show you how to check this assumption using SPSS, whether you use a histogram (with superimposed normal curve) or Normal P-P Plot; (b) explain how to interpret these diagrams; and (c) provide a possible solution if your data fails to meet this assumption.


You can check assumptions #2, #3, #4, #5 and #6 using SPSS. Assumptions #2 and #3 should be checked first, before moving onto assumptions #4, #5 and #6. We suggest testing these assumptions in this order because it represents an order where, if a violation to the assumption is not correctable, you will no longer be able to use a single linear regression (although you may be able to run another statistical test on your data instead). Also, you check assumptions #4, #5 and #6 at the same time as running the linear regression procedure in SPSS, so it is easier to deal with these after checking assumptions #2 and #3. Just remember that if you do not run the statistical tests on these assumptions correctly, the results you get when running a linear regression might not be valid. This is why we dedicate a number of sections of our enhanced a linear regression guide to help you get this right. You can find out about our enhanced content as a whole here, or more specifically, learn how we help with testing assumptions here.
In the section, Procedure, we illustrate the SPSS procedure to perform a linear regression assuming that no assumptions have been violated. First, we introduce the example that is used in this guide.
A salesperson for a large car brand wants to determine whether there is a relationship between an individual's income and the price they pay for a car. Therefore, the individual’s "income" is the independent (predictor) variable and the "price" they pay for a car is the dependent (outcome) variable. The salesperson wants to use this information to determine which cars to offer potential customers in new areas where average income is known.
SPSStop ^
Setup in SPSS
In SPSS, we created two variables so that we could enter our data: Income (the independent/predictor) variable, and Price (the dependent/outcome variable). It can also be useful to create a third variable, caseno, to act as a chronological case number. This third variable is used to make it easy for you to eliminate cases (e.g., significant outliers) that you have identified when checking for assumptions. However, we do not include it in the SPSS procedure that follows because we assume that you have already checked these assumptions. In our enhanced linear regression guide, we show you how to correctly enter data in SPSS to run a linear regression when you are also checking for assumptions. You can learn about our enhanced data setup content here. Alternately, we have a generic, "quick start" guide to show you how to enter data into SPSS, available here.
SPSStop ^
Test Procedure in SPSS
The five steps below show you how to analyse your data using linear regression in SPSS when none of the six assumptions in the previous section, Assumptions, have been violated. At the end of these five steps, we show you how to interpret the results from your linear regression. If you are looking for help to make sure your data meets assumptions #2, #3, #4, #5 and #6, which are required when using linear regression, and can be tested using SPSS, you can learn more in our enhanced guide here.
- Click Analyze > Regression > Linear... on the top menu.
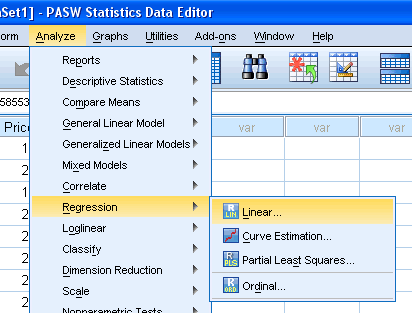
Published with written permission from SPSS Inc., an IBM Company. - You will be presented with the following dialog box:
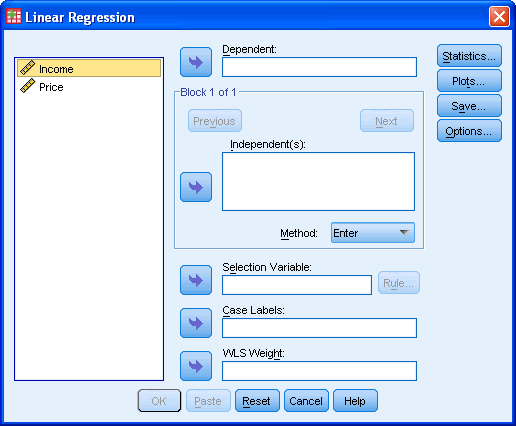
Published with written permission from SPSS Inc., an IBM Company. - Transfer the independent (predictor) variable, Income, into the Independent(s): box and the dependent (outcome) variable,Price, into the Dependent: box. You can do this by either drag-and-dropping or by using the
 buttons.
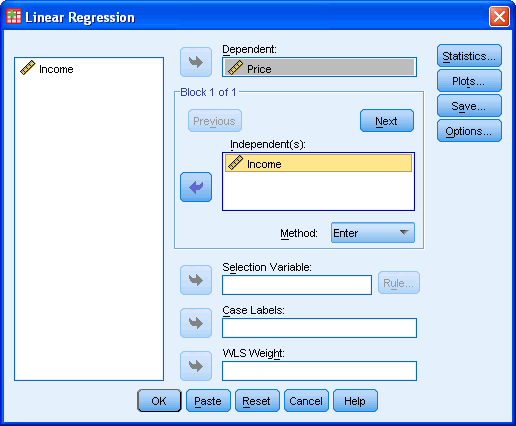
Published with written permission from SPSS Inc., an IBM Company. - You now need to check four of the assumptions discussed in the Assumptions section above: No significant outliers (assumption #3); independence of observations (assumption #4); homoscedasticity (assumption #5); and normal distribution of errors/residuals (assumptions #6). You can do this by using the
 and
and  features, and then selecting the appropriate tick boxes within these two dialogue boxes. In our enhanced linear regression guide, we show you which options to select in order to test whether your data meets these four assumptions.
 - When you have ticked the relevant options in the and option boxes above, click the
 button.
 - top ^
Output of Linear Regression Analysis
SPSS will generate quite a few tables of output for a linear regression. In this section, we show you only the three main tables required to understand your results from the linear regression procedure, assuming that no assumptions have been violated. A complete explanation of the output you have to interpret when checking your data for the six assumptions required to carry out linear regression is provided in our enhanced guide here. This includes relevant scatterplots, histogram (with superimposed normal curve) and Normal P-P Plot, and casewise diagnostics and Durbin-Watson statistic tables. Below, we focus on the results for the linear regression analysis only.
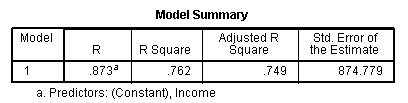
The first table of interest is the Model Summary table. This table provides the R and R2 value. The R value is 0.873, which represents the simple correlation. It indicates a high degree of correlation. The R2 value indicates how much of the dependent variable, "price", can be explained by the independent variable, "income". In this case, 76.2% can be explained, which is very large.
Published with written permission from SPSS Inc., an IBM Company.
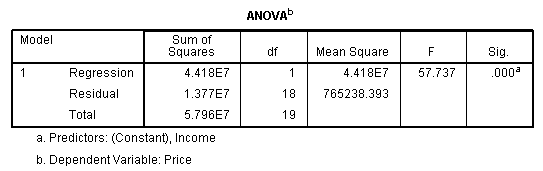
The next table is the ANOVA table. This table indicates that the regression model predicts the outcome variable significantly well. How do we know this? Look at the "Regression" row and go to the Sig. column. This indicates the statistical significance of the regression model that was applied. Here, p < 0.0005, which is less than 0.05, and indicates that, overall, the model applied can statistically significantly predict the outcome variable.
Published with written permission from SPSS Inc., an IBM Company.
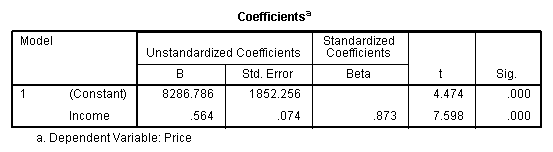
The table below, Coefficients, provides us with information on each predictor variable. This gives us the information we need to predict price from income. We can see that both the constant and income contribute significantly to the model (by looking at the Sig. column). By looking at the B column under the Unstandardized Coefficients column, we can present the regression equation as:
Price = 8287 + 0.564(Income)
Published with written permission from SPSS Inc., an IBM Company.
If you are unsure how to interpret regression equations, or how to use them to make predictions, we discussed this in our enhanced linear regression guide. We also show you how to write up the results from your assumptions tests and linear regression output if you need to report this in a dissertation/thesis, assignment or research report. We do this using the Harvard and APA styles. You can learn more about our enhanced content here.
Saturday, May 3, 2014
How do I report paired samples T-test data in APA style?
How do I report paired samples T-test data in APA style?:
'via Blog this'
'via Blog this'
Three things to report
You will want to include three main things about the Paired Samples T-Test when communicating results to others.
1. Test type and use
You want to tell your reader what type of analysis you conducted. If you don’t, your results won’t make much sense to the reader. You also want to tell your reader why this particular analysis was used. What did your analysis tests for?
Example
You can report data from your own experiments by using the template below.
“A paired-samples t-test was conducted to compare (your DV measure) _________ in (IV level / condition 1) ________and (IV level / condition 2)________ conditions.”
If we were reporting data for our example, we might write a sentence like this.
“A paired-samples t-test was conducted to compare the number of hours of sleep in caffeine and no caffeine conditions.”
2. Significant differences between conditions
You want to tell your reader whether or not there was a significant difference between condition means. You can report data from your own experiments by using the template below.
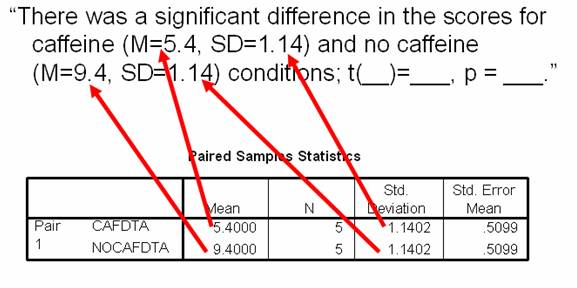
“There was a significant (not a significant) difference in the scores for IV level 1 (M=___, SD=___) and IV level 2 (M=___, SD=___) conditions; t(__)=___, p = ____”
Just fill in the blanks by using the SPSS output
Let’s start by filing in the Mean and Standard Deviation for each condition.
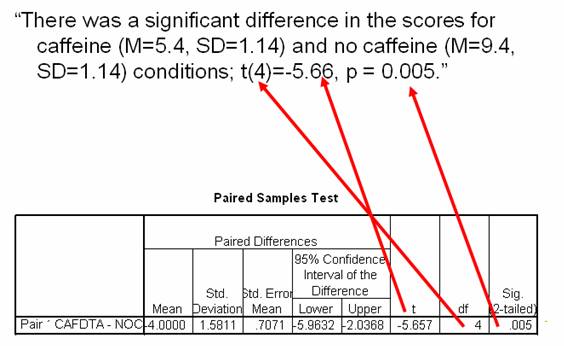
Now we’ll finish up by filling in the values related to the paired T-Test. Here we enter the degrees of freedom (df), the t-value (t), and the Sig. (2-tailed) value (often referred to as the p value).
Once the blanks are full…
You have a sentence that looks very scientific but was actually very simple to produce.
“There was a significant difference in the scores for caffeine (M=5.4, SD=1.14) and no caffeine (M=9.4, SD=1.14) conditions; t(4)=-5.66, p = 0.005.”
3. Report your results in words that people can understand
Since it might be hard for someone to figure out what that sentence means or how it relates to your experiment, you want to briefly recap in words that people can understand. Try to imagine trying to explain your results to someone who is not familiar with science. In one sentence, explain your results in easy to understand language.
Example
You might write something like this for our example.
“These results suggest that caffeine really does have an effect hours slept. Specifically, our results suggest that when humans consume caffeine, the number of hours they sleep decreases”
You could have also written the following sentence.
“These results suggest that caffeine really does have an effect hours slept. Specifically, our results suggest that when humans consume less caffeine, the number of hours they sleep increases.”
Both sentences are so much easier to understand than the scientific one will all of the numbers in it.
Let’s see how this looks all together
When you put the three main components together, results look something like this.
“A paired-samples t-test was conducted to compare hours of sleep in caffeine and no caffeine conditions. There was a significant difference in the scores for caffeine (M=5.4, SD=1.14) and no caffeine (M=9.4, SD=1.14) conditions; t(4)=-5.66, p = 0.005. These results suggest that caffeine really does have an hours slept. Specifically, our results suggest that when humans consume caffeine, the number of hours they sleep decreases.”
Looking good!
Saturday, April 26, 2014
DISTANCE EDUCATION COMMUNICATIONS: THE SOCIAL PRESENCE AND MEDIA RICHNESS OF INSTANT MESSAGING
DISTANCE EDUCATION COMMUNICATIONS:
THE SOCIAL PRESENCE AND MEDIA RICHNESS
OF INSTANT MESSAGING
Stephen J. Kuyath
The William States Lee College of Engineering
University of North Carolina at Charlotte
Susan J. Winter
The Belk College of Business Administration
University of North Carolina at Charlotte
'via Blog this'
THE SOCIAL PRESENCE AND MEDIA RICHNESS
OF INSTANT MESSAGING
Stephen J. Kuyath
The William States Lee College of Engineering
University of North Carolina at Charlotte
Susan J. Winter
The Belk College of Business Administration
University of North Carolina at Charlotte
http://sc-d7.sloan-c-support.org/sites/default/files/articles/downloads/v10n4_kuyath_0.pdf
'via Blog this'
The Impact of Learning Communities on the Persistence of Low-Income Students
n.
Learning Better Together:
The Impact of Learning Communities on the
Persistence of Low-Income Students
Cathy McHugh Engstrom, Ph.D. and
Vincent Tinto, Ph.D. Syracuse University1
'via Blog this'
Abstract
This article describes the major findings from a longitudinal study of the impact of
learning communities on the success of academically under-prepared, low-income
students in 13 community colleges across the country. In this study, we employed
both quantitative longitudinal survey and qualitative case study and interview
methods. We utilized the former in order to ascertain to what degree participation
in a learning community enhanced student success and the latter to understand
why and how it is that such communities do so. The findings strongly support
adapting the learning community model to basic skills instruction to improve
learning and persistence for this population.
http://www.sdbor.edu/services/studentaffairs/documents/LearningBetterTogether_Engstrom-Tinto-2008.pdf
Learning Communities | Washington Center
Learning Communities | Washington Center:
'via Blog this'
'via Blog this'
Linked Courses for General Education and Integrative Learning: A Guide for Faculty and Administrators
Margot Soven, Dolores Lehr, Siskanna Naynaha, and Wendy Olson, editors. Sterling, VA: Stylus Publishing. 2013.
Margot Soven, Dolores Lehr, Siskanna Naynaha, and Wendy Olson, editors. Sterling, VA: Stylus Publishing. 2013.
Powerful Learning Communities: A Guide to Developing Student, Faculty, and Professional Learning Communities to Improve Student Success and Organizational EffectivenessOscar T. Lenning, Denise M. Hill, Kevin P. Saunders, Alisah Solan, and Andria Stokes. Foreward by Vincent Tinto. Sterling, VA: Stylus Publishing. 2013.
Commencement Day: Six-Year Effects of a Freshman Learning Community Program at Kingsborough Community CollegeColleen Sommo, Alexander K. Mayer, Timothy Rudd, and Dan Cullinan, with Hannah Fresques. MDRC. July 2012.
The Effects of Learning Communities for Students in Developmental Education: A Synthesis of Findings from Six Community CollegesMary G. Visher, Michael J. Weiss, Evan Weissman, Timoth Rudd, and Heather D. Wathington, with Jedediah Teres and Kelley Fong. MDRC. July 2012.
A Primer for Learning Community Coordinators
Ana Torres-Bower. Cerritos College. 2011.
Ana Torres-Bower. Cerritos College. 2011.
Breaking New Ground: An Impact Study of Career-Focused Learning Communities at Kingsborough Community College
Mary G. Visher and Jedediah Teres, with Phoebe Richman. MDRC. July 2011.
Mary G. Visher and Jedediah Teres, with Phoebe Richman. MDRC. July 2011.
Learning Communities for Students in Developmental Math: Impact Studies at Queensborough and Houston Community Colleges
Evan Weissman, Kristin F. Butcher, Emily Schneider, Jedediah Teres, Herbert Collado, and David Greenberg with Rashida Welbeck. MDRC. February 2011.
Evan Weissman, Kristin F. Butcher, Emily Schneider, Jedediah Teres, Herbert Collado, and David Greenberg with Rashida Welbeck. MDRC. February 2011.
Online Learning Communities' Student Survey: Highlights from the 2011-12 Survey
Maureen Pettitt. Skagit Valley College. 2011.
Maureen Pettitt. Skagit Valley College. 2011.
Five High-Impact Practices: Research on Learning Outcomes, Completion, and Quality
Jayne E. Brownell and Lynn E. Swaner. American Association of Colleges and Universities (AAC&U). Washington, D.C. 2010. Chapter 2. pp. 13-21.
Jayne E. Brownell and Lynn E. Swaner. American Association of Colleges and Universities (AAC&U). Washington, D.C. 2010. Chapter 2. pp. 13-21.
Learning Communities for Students in Developmental Reading: An Impact Study at Hillsborough Community College
Michael J. Weiss, Mary G. Visher, and Heather Wathington with Jed Teres and Emily Schneider. MDRC. June 2010.
Michael J. Weiss, Mary G. Visher, and Heather Wathington with Jed Teres and Emily Schneider. MDRC. June 2010.
Scaling Up Learning Communities: The Experiences of Six CollegesMary Visher, Emily Schneider, Heather Wathington, and Herbert Collage. MDRC. March 2010.
Underprepared, Ethnically Diverse Community College Students: Factors Contributing to Persistence
Peter Barabatis. Journal of Developmental Education 33:3. Spring 2010.
Peter Barabatis. Journal of Developmental Education 33:3. Spring 2010.
When Faculty Assess Integrative Learning
Emily Lardner and Gillies Malnarich. Change: The Magazine of Higher Learning. Sept./Oct. 2009.
Emily Lardner and Gillies Malnarich. Change: The Magazine of Higher Learning. Sept./Oct. 2009.
Promoting Partnerships for Student Success: Lessons from the SSPIRE Initiative
Evan Weissman, Oscar Cerna, Christian Geckeler, Emily Schneider, Derek V. Price, and Thomas J. Smith. MDRC. July 2009.
Evan Weissman, Oscar Cerna, Christian Geckeler, Emily Schneider, Derek V. Price, and Thomas J. Smith. MDRC. July 2009.
High-Impact Practices: Applying the Learning Outcomes Literature to the Development of Successful Campus Programs
Jayne E. Brownell and Lynn E. Swaner. Peer Review. Spring 2009.
Jayne E. Brownell and Lynn E. Swaner. Peer Review. Spring 2009.
Special Issue: Assessing Learning in Learning Communities
Emily Lardner and Gillies Malnarich, with others. Journal of Learning Communities Research, 3(3). December 2008/January 2009.
Emily Lardner and Gillies Malnarich, with others. Journal of Learning Communities Research, 3(3). December 2008/January 2009.
Learning Communities and the Quest for Quality
Barbara L. Smith and Jean MacGregor. Quality Assurance in Education. 17(2). 2009.
Barbara L. Smith and Jean MacGregor. Quality Assurance in Education. 17(2). 2009.
A Good Start: Two-Year Effects of a Freshman Learning Community Program at Kingsborough Community College
Susan Scrivener, Dan Bloom, Allen LeBlanc, Christina Paxson, Cecilia Elena Rouse, and Colleen Sommo. MDRC. March 2008.
Susan Scrivener, Dan Bloom, Allen LeBlanc, Christina Paxson, Cecilia Elena Rouse, and Colleen Sommo. MDRC. March 2008.
A New Era in Learning Community Work: Why the Pedagogy of Intentional Integration Matters
Emily Lardner and Gillies Malnarich. Change: The Magazine of Higher Learning. July/August 2008.
Emily Lardner and Gillies Malnarich. Change: The Magazine of Higher Learning. July/August 2008.
High Impact Educational Practices: What They Are, Who Has Access to Them, and Why They Matter
George D. Kuh. American Association of Colleges and Universities (AAC&U). 2008.
George D. Kuh. American Association of Colleges and Universities (AAC&U). 2008.
Learning Better Together: The Impact of Learning Communities on the Persistence of Low-Income Students
Cathy McHugh Engstrom and Vincent Tinto. Opportunity Matters. 1. 2008.
Cathy McHugh Engstrom and Vincent Tinto. Opportunity Matters. 1. 2008.
Learning Community Participation and Educational Outcomes: Direct, Indirect, and Contingent Relationships Gary Pike, George Kuh, and Alexander C. McCormick. Paper presented at the Annual Meeting of the Association for the Study of Higher Education. Jacksonville, FL. November 2008.
Sustaining Learning Communities: Moving from Curricular to Educational Reform
Emily Lardner and Gillies Malnarich. Perspectives. Winter 2008.
Emily Lardner and Gillies Malnarich. Perspectives. Winter 2008.
The Impact of a "Healthy Youth" Learning Community on Student Learning Outcome MeasuresKaren L. Butler and Phyllis Worthy Dawkins. The Journal of Negro Education, 77:3. Summer 2008.
College Learning for the New Global Century
National Leadership Council for Liberal Education & America's Promise. American Association of Colleges and Universities (AAC&U). 2007.
National Leadership Council for Liberal Education & America's Promise. American Association of Colleges and Universities (AAC&U). 2007.
Experiences that Matter: Enhancing Student Learning and Success: National Survey of Student Engagement (NSSE) Annual Report 2007
National Survey of Student Engagement. 2007.
National Survey of Student Engagement. 2007.
Where are Learning Communities Now? National Leaders Take Stock
Jean MacGregor and Barbara Leigh Smith. About Campus. May-June 2005.
Jean MacGregor and Barbara Leigh Smith. About Campus. May-June 2005.
Adding Value: Learning Communities and Student Engagement
Chun-Mei Zhao and George D. Kuh. Research in Higher Education 45:2. March 2004.
Chun-Mei Zhao and George D. Kuh. Research in Higher Education 45:2. March 2004.
Learning Communities: Reforming Undergraduate Education
Barbara Leigh Smith, Jean MacGregor, Roberta S. Matthews, and Faith Gabelnick. San Francisco, CA: Jossey-Bass. 2004.
Barbara Leigh Smith, Jean MacGregor, Roberta S. Matthews, and Faith Gabelnick. San Francisco, CA: Jossey-Bass. 2004.
Sustaining and Improving Learning Communities
Jodi Levine Laufgraben and Nancy S. Shapiro. San Francisco, CA: Jossey-Bass. 2004.
Jodi Levine Laufgraben and Nancy S. Shapiro. San Francisco, CA: Jossey-Bass. 2004.
Learning Communities and Fiscal Reality: Learning in a Time of Restricted Resources
Alan Guskin, Mary B. Marcy, and Barbara Leigh Smith. National Learning Communities Project monograph. Olympia, WA: Washington Center. 2003.
Alan Guskin, Mary B. Marcy, and Barbara Leigh Smith. National Learning Communities Project monograph. Olympia, WA: Washington Center. 2003.
Learning Communities and the Academic Library
Sarah Pederson. National Learning Communities Project monograph. Olympia, WA: Washington Center. 2003.
Sarah Pederson. National Learning Communities Project monograph. Olympia, WA: Washington Center. 2003.
Learning Communities in Community Colleges
Julia Fogarty, Lynn Dunlap, et al. National Learning Communities Project monograph. Olympia, WA: Washington Center. 2003.
Julia Fogarty, Lynn Dunlap, et al. National Learning Communities Project monograph. Olympia, WA: Washington Center. 2003.
Learning Communities in Liberal Arts Colleges
Karen Spear with J. David Arnold, Grant H. Cornwell, Eve Walsh Stoddard, Richard Guarasci, and Roberta S. Matthews. National Learning Communities Project monograph. Olympia, WA: Washington Center. 2003.
Karen Spear with J. David Arnold, Grant H. Cornwell, Eve Walsh Stoddard, Richard Guarasci, and Roberta S. Matthews. National Learning Communities Project monograph. Olympia, WA: Washington Center. 2003.
Learning Communities in Research Universities
John O'Connor with others. National Learning Communities Project monograph. Olympia, WA: Washington Center. 2003.
John O'Connor with others. National Learning Communities Project monograph. Olympia, WA: Washington Center. 2003.
Learning Community Research and Assessment: What We Know Now
Kathe Taylor, William S. Moore, Jean MacGregor, and Jerri Lindblad. National Learning Communities Project monograph. Olympia, WA: Washington Center. 2003.
Kathe Taylor, William S. Moore, Jean MacGregor, and Jerri Lindblad. National Learning Communities Project monograph. Olympia, WA: Washington Center. 2003.
The Challenge of Learning Communities as a Growing National Movement
Barbara Leigh Smith. American Association of Colleges and Universities (AAC&U). Peer Review 3:4. 2001.
Barbara Leigh Smith. American Association of Colleges and Universities (AAC&U). Peer Review 3:4. 2001.
Creating Learning Communities: A Practical Guide to Winning Support, Organizing for Change, and Implementing Programs
Nancy S. Shapiro and Jodi Levine. San Francisco, CA: Jossey-Bass. 1999.
Nancy S. Shapiro and Jodi Levine. San Francisco, CA: Jossey-Bass. 1999.
Learning Communities: New Structures, New Partnerships for Learning
Jodi Levine, editor. First Year Experience Monograph Series. 1999.
Jodi Levine, editor. First Year Experience Monograph Series. 1999.
The Powerful Potential of Learning Communities: Improving Education for the Future
Oscar Lenning and Larry Ebbers. ASHE. 1999.
Oscar Lenning and Larry Ebbers. ASHE. 1999.
Why Learning Communities? Why Now?
K. Patricia Cross. About Campus. July-August 1998.
K. Patricia Cross. About Campus. July-August 1998.
Learning Communities, Collaborative Learning, and the Pedagogy of Global Citizenship
Vincent Tinto. American Association of Higher Education (AAHE) Bulletin. March 1995.
Vincent Tinto. American Association of Higher Education (AAHE) Bulletin. March 1995.
Seminars: A Collection of Materials on Seminar Approaches and Evaluation Strategies
Jim Harnish, with K. Ann McCartney and Margaret Scarborough. Olympia, WA: Washington Center. 1995.
Jim Harnish, with K. Ann McCartney and Margaret Scarborough. Olympia, WA: Washington Center. 1995.
Building Learning Communities for New College Students: A Summary of Research Findings of the Collaborative Learning Project
Vincent Tinto, Anne Goodsell-Love, and Pat Russo. University Park, PA: The Pennsylvania State University NCTLA. 1994.
Vincent Tinto, Anne Goodsell-Love, and Pat Russo. University Park, PA: The Pennsylvania State University NCTLA. 1994.
Learning Communities: Creating Connections Among Students, Faculty, and DisciplinesFaith Gabelnick, Jean MacGregor, Roberta Matthews and Barbara Smith. New Directions for Teaching and Learning. Number 41. Spring 1990.
The Rationale for Learning Communities
Patrick Hill. Speech. October 22, 1985.
Patrick Hill. Speech. October 22, 1985.
Subscribe to:
Posts (Atom)